Elastic Stack - CSV data processing
Published On: 2019/05/11
In this article, we will walk through the basic setup required to load a csv file into elasticsearch using filebeat an view it in kibana. Elasticsearch is an open source distributed search and analytics engine build over Lucene. It provides REST services to create search and manupulate data. Kibana is the frontend server connected to Elasticsearch. It has lot of nice feature and the UI is really awesome. Beats are lightweight data shippers which sends data from source systems to elasticsearch (or logstash).
Setup Elasticsearch
Installation and basic setup is very simple. Since our aim in this series is mainly the features of ELK stack, I will continue with the basic setup provided along with the installation.
- Download the software from https://www.elastic.co/downloads/elasticsearch (select the artifact based on your operating system)
- Extract it and then run the server/service.
Setup Kibana
- Download the kibana server from https://www.elastic.co/downloads/kibana
- Elasticsearch connection url is by default configured in the configuration file (config/kibana.yml).
- Run the server
Once both the servers are running, you can see Kibana UI is loaded.
Configure elasticsearch pipeline for CSV processing
If the configuration and server is started let us move to setting a CSV processor in elasticsearch. For this, I will be using Pipeline feature of elasticsearch instead of setting up Logstash server. Elasticsearch has different node types and one among them is Ingest node. Ingest node is used to pre-process the document before actual indexing happens. The pipeline configuration helps the ingest node to pre-process the document and transform the document as per the instructions provided in the pipeline processors. Please note that all nodes in elasticsearch are ingest node by default but it can be disabled by adding the configuration in elasticsearch.yml file.
node.ingest: false
In this article, I will be using the taxi trip data which can be downloaded from NYC opendata (https://s3.amazonaws.com/nyc-tlc/trip+data/green_tripdata_2018-01.csv)
The data dictionary of this csv file could be found here.
The sample record required to setup this pipeline is :
2,2018-01-31 23:44:43,2018-01-31 23:50:53,N,1,24,41,1,1.25,6.5,0.5,0.5,1,0,,0.3,8.8,1,1
The pipeline for this structure is given below. In this example, I have used grok processor to extract the values and add it to the document. When there is an error in parsing the message element the preprocessor task adds a field “ingest_error” in the document. I haven’t used the field name “error” because it seems to be a reserved field name which a certain structure. “error”: { “type”: “message_parsing_exception”, “reason”: “Record to be ingested is not matching with the pre-processor configuration.” }
But in this example i will continue with the “ingest_error” field name as it is much simpler.
    PUT _ingest/pipeline/taxidatacsvs
    {
    "description" : "Taxi data ingestion",
    "processors": [
    {
        "grok": {
        "field": "message",
        "patterns": [
            "%{NUMBER:vendor_id},%{TIMESTAMP_ISO8601:lpep.pickup_datetime},%{TIMESTAMP_ISO8601:lpep.dropoff_datetime},%{WORD:store_and_fwd_flag},%{NUMBER:rate_code_id},%{NUMBER:pu_location_id},%{NUMBER:do_location_id},%{NUMBER:passenger_count},%{NUMBER:trip_distance},%{NUMBER:fare_amount},(?:%{NUMBER:extra})?,%{NUMBER:mta_tax},(?:%{NUMBER:tip_amount})?,(?:%{NUMBER:tolls_amount})?,(?:%{NUMBER:ehail_fee})?,(?:%{NUMBER:improvement_surcharge}),%{NUMBER:total_amount},%{NUMBER:payment_type},%{NUMBER:trip_type}"
        ]
        }
    }
    ],
    "on_failure" : [
        {
        "set" : {
            "field" : "ingest_error",
            "value" : " - Error processing message - "
        }
        }
    ]
}Configure Filebeat
Download the filebeat from https://www.elastic.co/downloads/beats/filebeat
Configure the path to the csv file green_tripdata_2018-01.csv. The configuration file (filebeat.yml) could be found in the filebeat folder
paths: - D:\public-data-set\toload\green_tripdata_2018-01.csv
Configure the additional fields to identify the operator, month and year.
fields: operator: green month: 01 year: 2018
In the elasticsearch output configuration section configure the pipeline. Keep the default index name provided in the configuration file. If you change it to your own index name then you need to configure “setup.template.name” and “setup.template.pattern” fields.
 output.elasticsearch:
 # Array of hosts to connect to.
     hosts: ["localhost:9200"]
     pipeline: "taxidatacsvs"
Run the filebeat. Make sure that you enabled the input specific configuration.
 - type: log

 # Change to true to enable this input configuration.
 enabled: true
Index configuration in Kibana
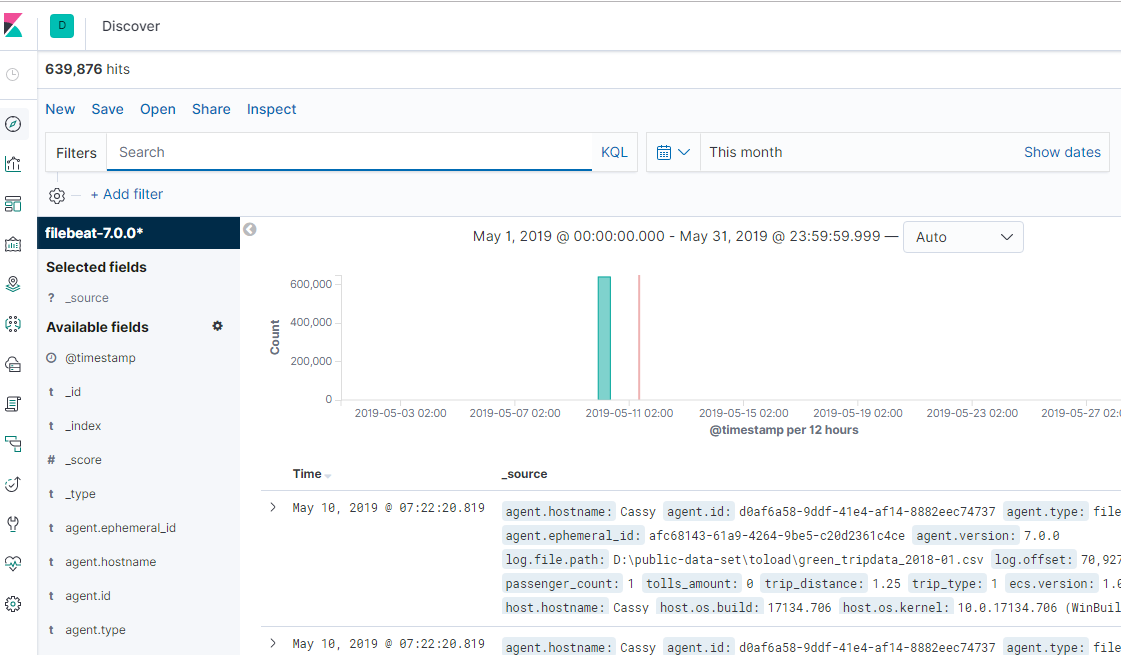
It is now the time to view the data in Kibana. Go to the Management page and create the index patterns which has to be viewed in Kibana. As I am using the version 7.0.0 then index pattern when the data is loaded is filebeat-7.0.0*.
Once the index pattern is setup you can view the data in the discover page of Kibana.
Conclusion
In this first article of elastic series, I tried to explain how to setup elastic products to stream the csv records, ingest node pipeline to preprocess the csv records, store it in Elasticsearch and then visualize it in Kibana.
Your feedback is a Reward!